Ta4j Wiki
Documentation, examples and further information of the ta4j project
This project is maintained by ta4j Organization
Trendlines & Swing Points
Trendlines and swing points are the core building blocks behind support/resistance analysis, breakout systems, and Elliott-style structure detection. Ta4j ships a full toolkit for detecting swings, turning them into markers, and projecting data-driven support and resistance lines that behave the way traders draw them by hand.
What you get
- Fractal swing detectors: window-based swing highs/lows with configurable symmetry and tolerance for flat tops/bottoms.
- ZigZag swing detectors: ATR/price-threshold reversals for adaptive swing confirmation without fixed lookahead windows.
- Swing markers:
SwingPointMarkerIndicatorconverts swing indexes into chart-friendly markers (values only on swing bars,NaNelsewhere). - Trendlines:
TrendLineSupportIndicator/TrendLineResistanceIndicatorthat score every valid line in the lookback window and pick the best candidate with tunable weights and touch tolerance. - Chart-ready metadata:
getSwingPointIndexes()andgetCurrentSegment()expose anchors, slope/intercept, and scoring so you can debug or annotate charts.
Quick start: plot swings and lines
BarSeries series = CsvFileBarSeriesDataSource.loadSeriesFromFile(); // daily AAPL sample

// 5–bar fractal swings (symmetric window, no equal lows/highs allowed)
LowPriceIndicator low = new LowPriceIndicator(series);
HighPriceIndicator high = new HighPriceIndicator(series);
RecentFractalSwingLowIndicator swingLows = new RecentFractalSwingLowIndicator(low, 5, 5, 0);
RecentFractalSwingHighIndicator swingHighs = new RecentFractalSwingHighIndicator(high, 5, 5, 0);

// Markers only where a swing is confirmed
SwingPointMarkerIndicator swingLowMarkers = new SwingPointMarkerIndicator(series, swingLows);
SwingPointMarkerIndicator swingHighMarkers = new SwingPointMarkerIndicator(series, swingHighs);

// Data-driven support/resistance lines over the last 200 bars
TrendLineSupportIndicator support = new TrendLineSupportIndicator(series, 5, 200);
TrendLineResistanceIndicator resistance = new TrendLineResistanceIndicator(series, 5, 200);

ChartWorkflow charts = new ChartWorkflow("temp/charts");
ChartPlan plan = charts.builder()
    .withTitle("Trendlines with fractal swing markers")
    .withSeries(series)
    .withIndicatorOverlay(support).withLineColor(Color.GREEN).withOpacity(0.6f)
    .withIndicatorOverlay(resistance).withLineColor(Color.RED).withOpacity(0.6f)
    .withIndicatorOverlay(swingLowMarkers).withLineColor(Color.GREEN).withLineWidth(3f).withConnectAcrossNaN(true)
    .withIndicatorOverlay(swingHighMarkers).withLineColor(Color.RED).withLineWidth(3f).withConnectAcrossNaN(true)
    .toPlan();
charts.display(plan);
Swing point detectors
Fractal swings (window-based)
RecentFractalSwingHighIndicator / RecentFractalSwingLowIndicator confirm a swing when the candidate bar beats its neighbors inside a symmetric or asymmetric window.
precedingHigherBars/precedingLowerBars: how many bars immediately before must be strictly above/below the candidate. Must be ≥ 1 (default convenience constructor uses 3).followingHigherBars/followingLowerBars: how many bars after must be strictly above/below the candidate. Needs future bars, so swings confirm only after this window elapses.allowedEqualBars: how many bars on each side may equal the candidate value (helps catch rounded tops/bottoms instead of rejecting plateaus).- Defaults:
new RecentFractalSwingLowIndicator(series)→ 3/3/0 on lows (highs mirror the parameters).
Use fractals when you want visually obvious turning points and don’t mind waiting a few bars for confirmation.
// 7-bar symmetric window that tolerates one equal neighbor on each side
RecentFractalSwingHighIndicator majorHighs = new RecentFractalSwingHighIndicator(high, 7, 7, 1);
int latestHighIndex = majorHighs.getLatestSwingHighIndex(series.getEndIndex());
ZigZag swings (reversal-threshold based)
RecentZigZagSwingHighIndicator / RecentZigZagSwingLowIndicator track swings confirmed when price reverses by at least a configured threshold—no fixed lookahead window.
- Driven by
ZigZagStateIndicator(price, reversalAmount). - Price indicator: typically
HighPriceIndicator,LowPriceIndicator, orClosePriceIndicator. - Reversal threshold (
reversalAmount): indicator in price units. Defaults toATR(14)in the convenience constructor; passConstantIndicatorfor fixed-point thresholds or any indicator for adaptive ones. - Returns
NaNuntil a reversal large enough to confirm the prior extreme.
ClosePriceIndicator close = new ClosePriceIndicator(series);
// Confirm swings after a 1.5 * ATR move
ATRIndicator atr = new ATRIndicator(series, 14);
Indicator<Num> atrThreshold = BinaryOperationIndicator.product(atr, 1.5);
ZigZagStateIndicator zigzagState = new ZigZagStateIndicator(close, atrThreshold);

RecentZigZagSwingLowIndicator zigzagLows = new RecentZigZagSwingLowIndicator(zigzagState, close);
RecentZigZagSwingHighIndicator zigzagHighs = new RecentZigZagSwingHighIndicator(zigzagState, close);
Showing swings on charts
SwingPointMarkerIndicator outputs prices only at swing indexes (NaN elsewhere) so chart overlays become discrete markers instead of lines.
SwingPointMarkerIndicator swingLowMarkers = new SwingPointMarkerIndicator(series, swingLows);
SwingPointMarkerIndicator swingHighMarkers = new SwingPointMarkerIndicator(series, swingHighs);

chart.builder()
    .withSeries(series)
    .withIndicatorOverlay(swingLowMarkers).withLineColor(Color.GREEN).withLineWidth(3f).withConnectAcrossNaN(true)
    .withIndicatorOverlay(swingHighMarkers).withLineColor(Color.RED).withLineWidth(3f).withConnectAcrossNaN(true)
    .toPlan();
Trendline indicators
TrendLineSupportIndicator and TrendLineResistanceIndicator project the “best” straight line across the last barCount bars using swing highs/lows as anchors. They:
- Recompute on every new bar, looking back
barCountbars (useInteger.MAX_VALUEto span the full series; minimum is 2). - Return
NaNuntil at least two swings exist inside the window. - Favor lines that connect many swings, include the extreme, avoid being violated, hug price, and use recent anchors.
Core inputs
- Swing source: pass either a price indicator (internally creates a fractal swing detector) or any
RecentSwingIndicator(e.g., ZigZag swings). - Swing window:
barCountcaps how far back anchors can be chosen. - Symmetry helper: overloads accept
surroundingHigherBars/surroundingLowerBarsfor quick fractal setups.
// Fractal-based support line over the last 300 bars, heavier bias to touching many swings
TrendLineSupportIndicator support = new TrendLineSupportIndicator(
    series,
    5,               // surrounding higher bars
    300,
    TrendLineSupportIndicator.ScoringWeights.touchCountBiasPreset()
);

// ZigZag-based resistance line using a custom swing detector
ZigZagStateIndicator zz = new ZigZagStateIndicator(high,
        new ConstantIndicator<>(series, series.numFactory().numOf(25)));
RecentZigZagSwingHighIndicator swingHighs = new RecentZigZagSwingHighIndicator(zz, high);
TrendLineResistanceIndicator resistance = new TrendLineResistanceIndicator(
    swingHighs,
    5, 5,            // preceding / following lower bars (kept for symmetry)
    250
);
Scoring weights (pick the “best” line)
Weights must sum to 1.0;
Each lever tilts the search toward a different style of line:
- Touch count: maximizes the number of swing points that sit on the line. Prioritize when you want high “market memory” or range-trading confluence; deprioritize in fresh breakouts where many touches may mean the level is already fatigued. Theory: the more times price tests a level without breaking, the more orders accumulate there (self-fulfilling support/resistance).
- Touches extreme swing: forces the line through the highest high (resistance) or lowest low (support). Prioritize for textbook diagonal trendlines and for enforcing HH/LL structure; deprioritize when the extreme is a news wick/outlier and you prefer to anchor to closes or secondary swings. Theory: extremes mark the point of maximum imbalance between supply and demand, so anchoring them keeps the line tied to the pivotal pivot.
- Outside count penalty: discourages swings that pierce the line. Prioritize when you only trust untouched levels (e.g., for breakout systems); deprioritize in markets with frequent stop-hunts/wicks where minor breaches are acceptable. Theory: every violation weakens a barrier—more breaches imply the line has already “broken” and should be discounted.
- Average deviation: rewards lines that stay close to all swings, not just the anchors. Prioritize in choppy structures to avoid lines that bisect noise; deprioritize when you deliberately allow wide channels and care more about the exact anchor choices. Theory: akin to minimizing regression residuals so the line reflects the overall swing cloud rather than two arbitrary points.
- Anchor recency: favors anchors drawn from the latest swings. Prioritize for intraday or regime-shifting markets where old pivots lose relevance; deprioritize for multi-year macro trendlines where early anchors still define the structure. Theory: markets are non-stationary, so fresher swings often carry more predictive power than distant history. Default weight is 5% (reduced from 15% in earlier versions) to place less emphasis on recency and more on touch count and extreme point inclusion.
TrendLineSupportIndicator.ScoringWeights customWeights =
    TrendLineSupportIndicator.ScoringWeights.builder()
        .weightForTouchingSwingPoints(0.55)
        .weightForTouchingExtremeSwing(0.20)
        .weightForKeepingSwingsInsideLine(0.10)
        .weightForStayingCloseToSwings(0.10)
        .weightForRecentAnchorPoints(0.05)  // Default is now 0.05 (5%)
        .build();

TrendLineSupportIndicator adaptiveSupport = new TrendLineSupportIndicator(series, 4, 180, customWeights);
Presets: touchCountBiasPreset() (connect as many swings as possible) and extremeSwingBiasPreset() (force the line through the extreme swing).
Touch tolerance (what counts as “on the line”)
Tolerance is applied per swing to count a touch:
- Percentage of swing range (
ToleranceSettings.percentage(fraction, minimumAbsolute), default 2% with a 1e-9 floor): scales with volatility so low-vol markets get tighter lines while wide ranges relax the band. Prioritize for cross-asset backtests and adaptive setups; deprioritize when a single massive bar would bloat tolerance. Theory: proportional error bands keep significance tied to recent price dispersion. - Absolute price (
ToleranceSettings.absolute(absolutePrice)): fixed currency/points band. Prioritize when you think in ticks/pips or the instrument’s price is range-bound; deprioritize if price can double/halve, because the tolerance will become too loose or too strict. Theory: mirrors how discretionary traders eyeball “about X dollars” of breathing room. - Tick size (
ToleranceSettings.tickSize(tickSize)): integer multiples of the exchange’s minimum price increment. Prioritize for futures/FX where microstructure enforces tick steps; deprioritize on assets with fractional pricing or fragmented liquidity. Theory: snaps tolerance to the smallest executable move, reducing false misses from rounding. - Minimum absolute floor (
minimumAbsolutein percentage mode): guards against vanishingly small bands when the range compresses. Prioritize on low-priced or low-volatility products so minor rounding differences still count as touches; set conservatively if you want the band to shrink meaningfully in quiet markets. Theory: a floor avoids numerical precision artifacts masquerading as breaks.
TrendLineResistanceIndicator tightResistance = new TrendLineResistanceIndicator(
    series,
    4,
    150,
    TrendLineResistanceIndicator.ScoringWeights.defaultWeights(),
    TrendLineResistanceIndicator.ToleranceSettings.absolute(0.25) // 25 cents wide
);
Performance knobs & metadata
- Search caps: defaults limit the search to the most recent
64swing points and2048candidate pairs. Increase for longer histories; decrease for very noisy intraday data. - Segment metadata:
TrendLineSegment segment = support.getCurrentSegment();exposes anchors, slope, intercept, touch/outside counts, score, and window start/end—great for logging or overlay labels. - Descriptor/JSON:
support.toJson()serializes parameters and the swing subtree for persistence.
Runnable analysis harness
ta4jexamples.analysis.TrendLineAndSwingPointAnalysis is the companion example for this page. It performs regression-style headroom checks across bundled datasets for fractal and ZigZag swing sources, then renders a chart with support/resistance lines and swing markers.
Run it from the ta4j source checkout:
mvn -pl ta4j-examples -Dexec.mainClass=ta4jexamples.analysis.TrendLineAndSwingPointAnalysis exec:java
Use it after changing trendline scoring, swing detection, chart overlay rendering, or default search caps. In headless environments the checks still run; chart display is skipped or saved according to the example configuration.
Strategy patterns
ClosePriceIndicator close = new ClosePriceIndicator(series);
TrendLineResistanceIndicator resistance = new TrendLineResistanceIndicator(series, 5, 200);
TrendLineSupportIndicator support = new TrendLineSupportIndicator(series, 5, 200);

Rule breakoutLong = new CrossedUpIndicatorRule(close, resistance);
Rule bounceLong = new CrossedDownIndicatorRule(close, support)
        .and(new CrossedUpIndicatorRule(close, support));

Strategy trendlineStrategy = new BaseStrategy("Trendline break/bounce", breakoutLong, bounceLong.negation());
- Breakouts:
CrossedUpIndicatorRule(close, resistance)/CrossedDownIndicatorRule(close, support). - Bounces: require price to tag support/resistance within tolerance, then reverse with momentum (e.g., RSI cross) to filter noise.
- Structure filters: combine fractal markers and ZigZag swings—e.g., require a higher low swing plus a rising support slope before buying breakouts.
Visual examples
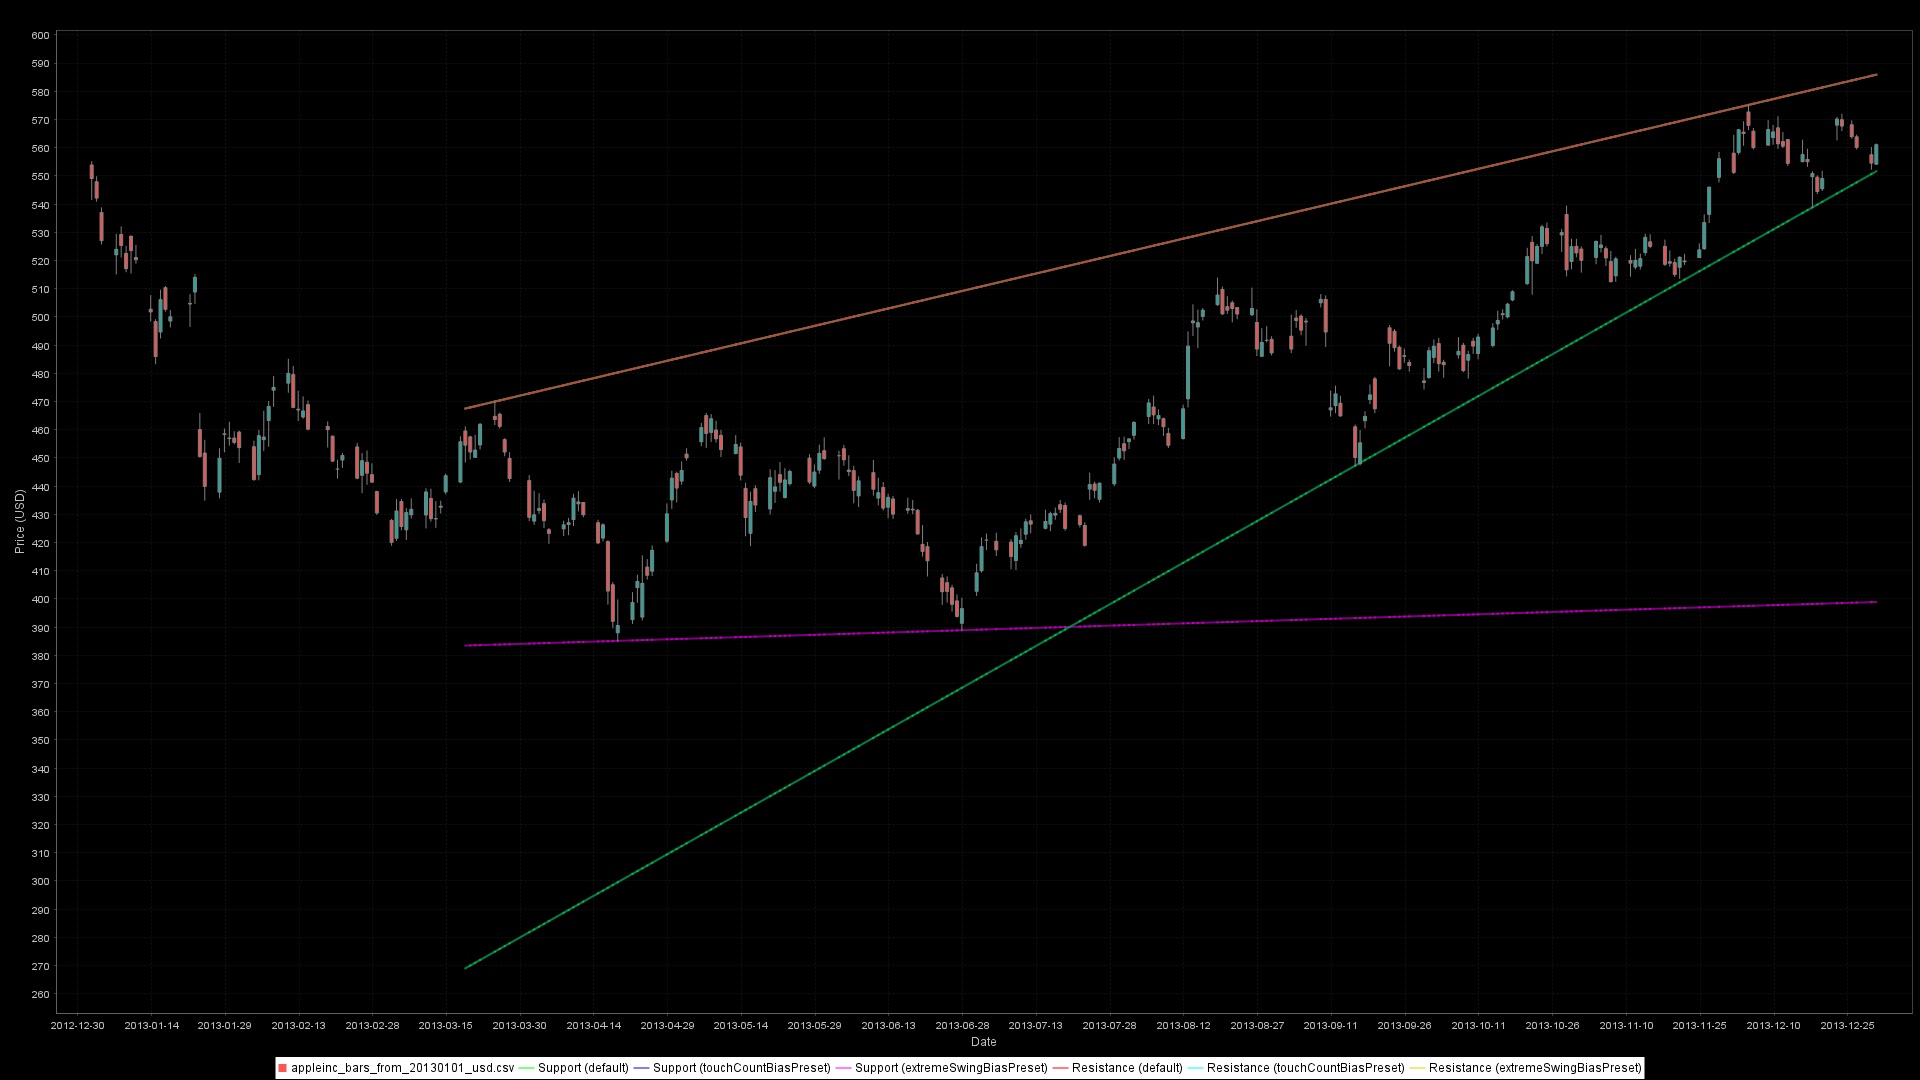 Support/resistance lines from fractal swings. Default (red/green), touch-count bias (cyan/blue), and extreme-bias (orange/magenta) presets make different anchor choices.
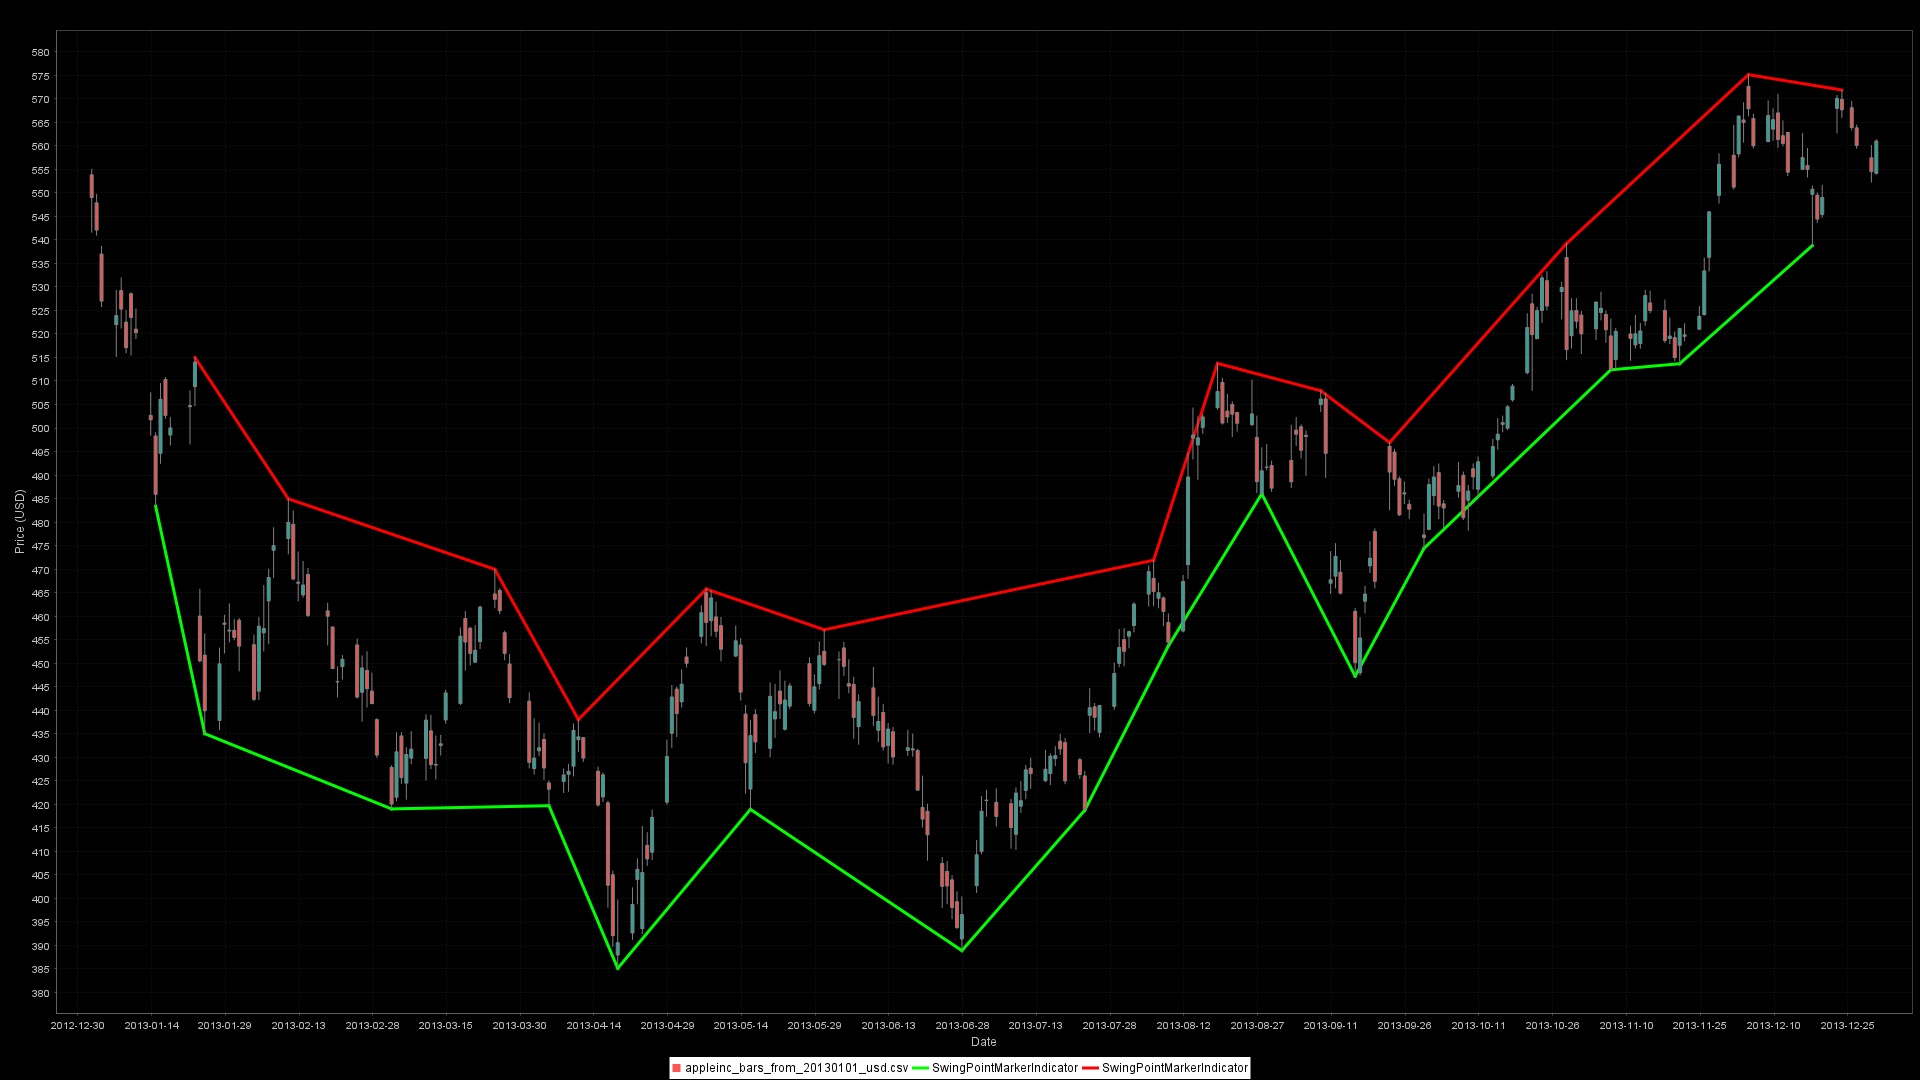 ZigZag-based swings confirmed after ATR-sized reversals. Fewer, higher-conviction swings compared to fractals.
Best practices & pitfalls
- Swings need future bars: fractals confirm only after the
following*window; ZigZag confirms after price moves by the threshold. Guard againstNaNwhen rules fire. - Align parameters with timeframe: wide windows on low-timeframe data will feel sluggish; on daily/weekly charts they remove noise.
- Keep price inputs consistent: if your ZigZag tracks highs/lows, feed the same price indicator into
RecentZigZagSwing*and the trendline. - Match lookback to data retention: if you set
series.setMaximumBarCount(250), keep trendlinebarCount <= 250or earlier anchors will be evicted. - Tune tolerance to the instrument: use absolute/tick-size tolerance for low-priced or fixed-tick assets; percentage works well for equities.
- Watch performance with dense swing series: if you detect thousands of swings, lower
maxSwingPointsForTrendlineor raise the reversal/plateau thresholds to avoid combinatorial explosions. - For chart overlays,
.withConnectAcrossNaN(true)connects sparse swing markers into lines; leave itfalsewhen you want discrete marker points.
Rationale Notes (2026-04-27)
- Added the runnable harness guidance from
ta4jexamples.analysis.TrendLineAndSwingPointAnalysis, introduced with support/resistance coverage in commit39194498. - Rechecked current trendline metadata and search-cap wording against
AbstractTrendLineIndicator,TrendLineSupportIndicator, andTrendLineResistanceIndicator.